Plotting datasets from file - English
- subtitles off
- captions off
This is a sample video. To access the full content,
please
Login
- Questions posted on Forums
- Gnuplot Tutorials - English
-
about data.txt file
I have downloaded gnu program in program file, where should I copy my data.txt file to?
00-01M 0-10S lkumaribmsce
Answer last updated on: May 22, 2021, 12:26 p.m.
-
formating
I have two questions;Q1. What is 'dt' in command plot "data.txt" using 1:3 title 'Y2' with linespoint lc 'blue' dt 1 lw 2Q2. In the video its shown how we can labl ticmarks in exponential notation. How can we do it as 10 to the power ie. 10^
07-08M 50-60S gs
Answer last updated on: May 27, 2021, 10:22 a.m.
-
Can we get the output in usual graphical format
Can we get out put in this graph format?
05-06M 20-30S sujit.s.shinde@gmail.com
Answer last updated on: May 22, 2021, 1:14 p.m.
-
1
 Overview of Gnuplot
 -
2
 Installation of Gnuplot on Windows OS
 -
3
 Introduction to Gnuplot
 -
4
 Example scripts and demo folder
 -
5
 Plotting functions
 -
6
 Set term and variations in output
 -
 Plotting datasets from file
 -
8
 Generate 3D plots and surfaces
 -
9
 Multiple plots in a canvas
 -
10
 Error bars and data fitting
 -
11
 LaTeX and Gnuplot
 -
12
 Statistics and box plot
 -
13
 Run gnuplot from Perl script
Questions posted on ST Forums:
1341 visits
Outline:
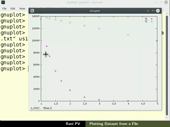
Plot datasets from a file Choose x and y data from a multi-column file Specify legend title in the plot Set and unset logarithmic scale for y-axis Set line width in the plot Set color of the line Change symbol size and style Change y-axis ticks to scientific notation Adjust border line color and line width Add time stamp to the plot
| Width: | 828 | Height: | 616 |
|---|---|---|---|
| Duration: | 00:08:59 | Size: | 4 MB |
Show video info

