Plotting Bar Charts and Scatter Plot - English
- subtitles off
- captions off
- English
This is a sample video. To access the full content,
please
Login
- Questions posted on Forums
- R Tutorials - English
-
What is the use of las command ?
What is the use las command the meaning of the value it is taking like las = "2" .What is the use of this 2 here?
05-06M 50-60S Saikatraj
Answer last updated on: Jan. 29, 2021, 11:50 a.m.
-
assignment question 2
While solving the assignment in the second question its been asked to plot a scatter plot of imdb_rating and imdb_num_votes. I did typed plot(x = movies$imdb_rating, y = movies$imbd_num_votes, main = "IMBD rating vs imbd num votes", ylab = "imbd num votes", xlab = "IMBD rating", ylim = c(0,100000), xlim = c(0,10), col = "red") I am not getting the scatter plot instead i am getting a straight dotted line across the x-axis. Could you please help.
09-10M 0-10S ASHABAREE
Answer last updated on: Aug. 7, 2020, 11:32 p.m.
-
Axis modification (add more markers & change names for y axis)
HiI have made a scatter plot using plot() function. I want to add more markers (there are 4 currently) and change the labels ( Eg 0e+00 into 0) in the Y-axis. Can you please advice? I am not using ggplot2.ThanksKarthik
09-10M 50-60S hi_kar
Answer last updated on: June 18, 2020, 10:45 p.m.
-
1
 Overview of R and RStudio
 -
2
 Installing R and RStudio on Linux
 -
3
 Installing R and RStudio on Windows
 -
4
 Introduction to basics of R
 -
5
 Introduction to Data Frames in R
 -
6
 Introduction to RStudio
 -
7
 Introduction to R script
 -
8
 Working directories in RStudio
 -
9
 Indexing and Slicing Data Frames
 -
10
 Creating Matrices using Data Frames
 -
11
 Operations on Matrices and Data Frames
 -
12
 Merging and Importing Data
 -
13
 Data types and Factors
 -
14
 Lists and its Operations
 -
15
 Plotting Histograms and Pie Chart
 -
 Plotting Bar Charts and Scatter Plot
 -
17
 Introduction to ggplot2
 -
18
 Aesthetic Mapping in ggplot2
 -
19
 Data Manipulation using dplyr Package
 -
20
 More Functions in dplyr Package
 -
21
 Pipe Operator
 -
22
 Conditional Statements
 -
23
 Functions in R
Questions posted on ST Forums:
13784 visits
Outline:
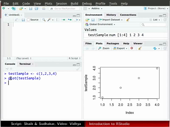
What is a bar chart Draw a bar chart Use the barplot function Add labels to the bar chart Adjust the labels of the bar chart What is a scatter plot Draw a scatter plot Use plot function with two objects Find the correlation coefficient Range of correlation coefficient
| Width: | 904 | Height: | 650 |
|---|---|---|---|
| Duration: | 00:11:06 | Size: | 4.9 MB |
Show video info

