Search Tutorials
The Tutorials in this series are created using Gnuplot 5.2.7, Gnuplot 5.2.6 on Windows 10 64 bit OS, Debian Linux OS 9.3 and Ubuntu Linux 16.04 OS. Gnuplot is a program for plotting graphs using terminal command lines. It is available for many platforms and is free of cost to download, install and use. It is one of the best liked plotting software in scientific community. The program supports, interactive plotting, generates hard copy plots of variety of user friendly file formats for printing and sharing. The software can also generate ASCII plots from remote servers. The software can generate, 2D graphs, 3D surfaces, histograms, web scripting and data fitting. Heat maps, transparency setting, multiplot mode, various symbol styles, graph color, line color and other formatting options are available for users of gnuplot. The program can handle advanced mathematics functions, transforms, axis operations and animations. A large collection of user friendly scripts exist online along with user forums. Gnuplot is actively developed for decades. Read more
Foss : Gnuplot - English
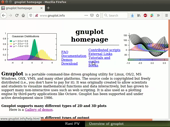
Outline: What is gnuplot Visit gnuplot website About popularity of gnuplot Books on gnuplot Learn about example scripts Documentation on gnuplot Features of gnuplot Benefits of gnupl..
Basic

Foss : Gnuplot - English
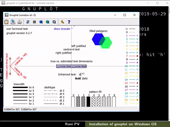
Outline: Familiarize with gnuplot software versions Download gnuplot Install gnuplot in Windows 10 OS Open console version of gnuplot Check the terminal capability with test command Fa..
Basic

Foss : Gnuplot - English
Outline: Download gnuplot 5.2.6 Familiarize with the software versions Extract files from tarball Build the gnuplot software Use Configure command to extract the files Use make comman..
Basic

Foss : Gnuplot - English
Outline: Access the demo folder with example files Familiarize with script structure Familiarize with comments and headers Load a script file Examples of Interactive scripts Load a 3D ..
Basic

Foss : Gnuplot - English
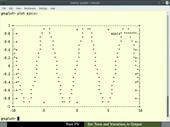
Outline: Plot sin(x), cos(x) and sin(x) + cos(x) Add and remove grid Zoom in and zoom out of the graph Move the legend position in the plot Add title to the plot Change the font style ..
Basic

Foss : Gnuplot - English
Outline: Set term command and help option Set different terminals for plotting About Interactive terminals Printing to postscript and svg files Option to set the postscript file output ..
Basic

Foss : Gnuplot - English
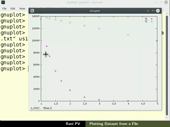
Outline: Plot datasets from a file Choose x and y data from a multi-column file Specify legend title in the plot Set and unset logarithmic scale for y-axis Set line width in the plot S..
Basic

Foss : Gnuplot - English
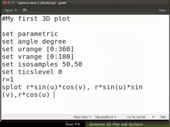
Outline: Generate a 3D plot with splot command Rotate the graph to change the viewing angle Color the two sides of the surface differently Use set isosamples command to define a fine gri..
Basic

Foss : Gnuplot - English
Outline: Set gnuplot to multiplot mode Define the position and size of each plot on the canvas Perform an iterative modification of the script Change the graph properties step by step I..
Basic

Foss : Gnuplot - English
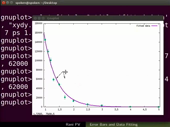
Outline: Add error bars to a plot Steps in fitting the data to an equation Define an equation to fit a given set of data points Set initial guess value for the coefficients in the equati..
Basic

Foss : Gnuplot - English
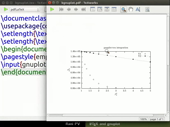
Outline: Write a gnuplot script incorporating Latex symbols in gnuplot Incorporate superscript and subscript in the latex symbols Learn the pause command Show Latex symbols in gnuplot gr..
Basic

Foss : Gnuplot - English
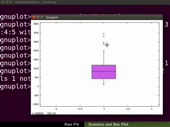
Outline: Plot string data on x-axis Specify xtics position for the string label Generate statistical summary with stats command About the statistical summary generated by gnuplot Make a..
Basic

Foss : Gnuplot - English
Outline: Run gnuplot commands using a Perl script Generate statistical summary for multiple input data files from gnuplot using Perl script Save the statistical summary files with differe..
Basic

